

IsoSpeak Reveals Immune Insight
Use IsoSpeak for automated on-site analysis and advanced, functional, single cell mapping:
Push-Button Informatics to Accelerate Your Workflows
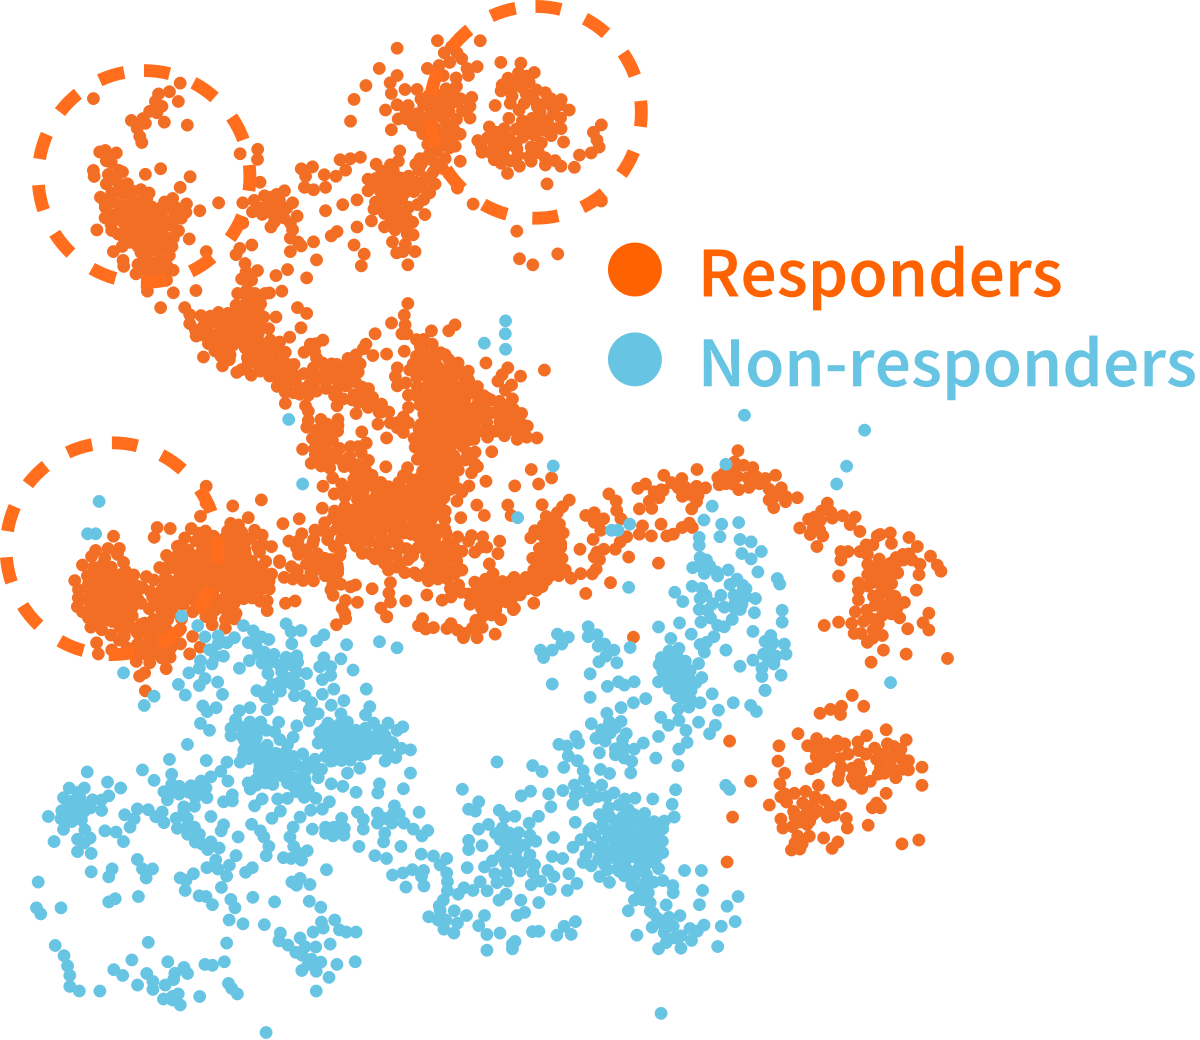
Bruker Cellular Analysis' t-SNE functional graphs plot cells by differentiating them based on their greatest cytokine-based functional differences.
IsoSpeak can visualize stratification differences driving responders vs. non-responders as shown in 40+ precedent data sets.
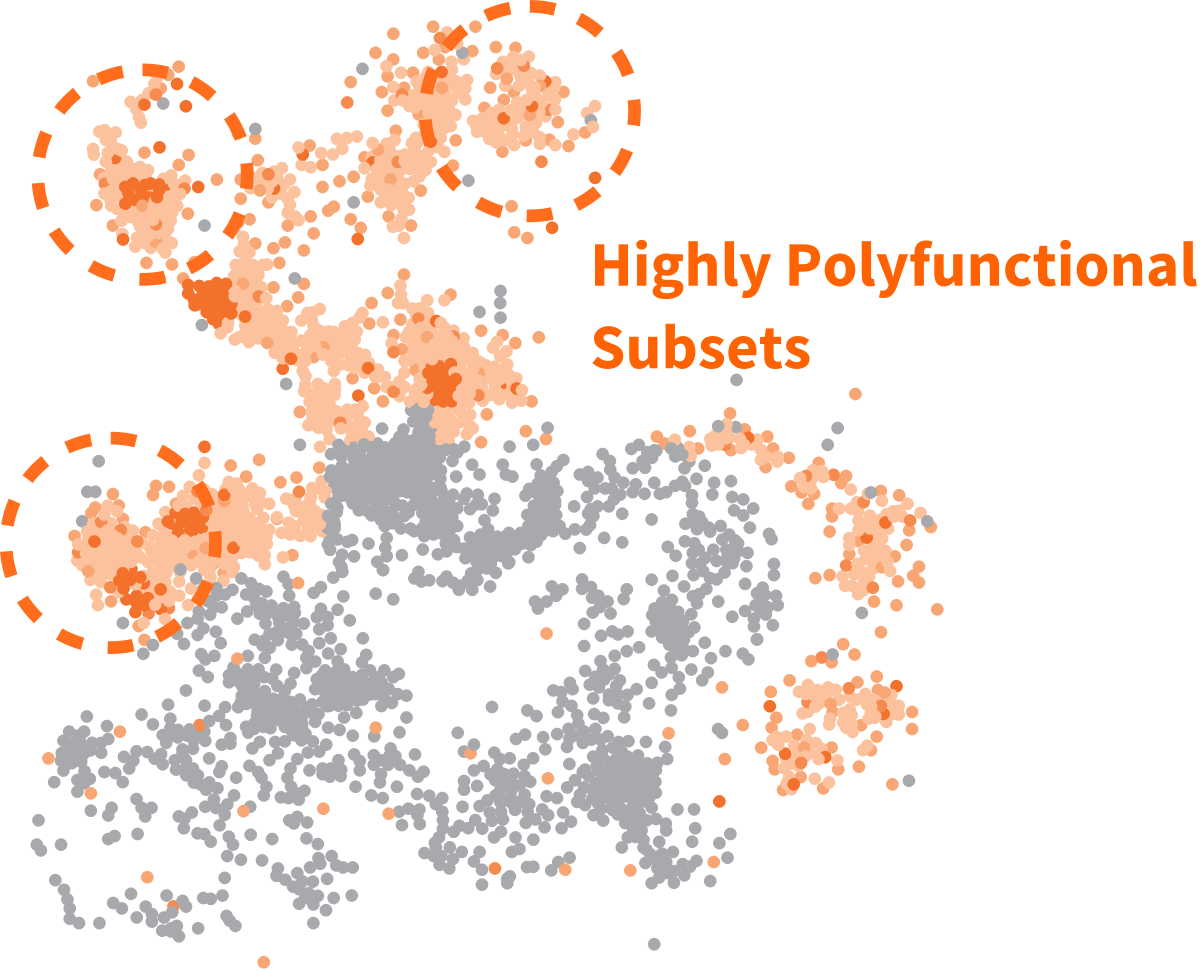
Visualized within the same functional plot, the t-SNE graph uncovers functional sources of the cellular biomarkers of response.
Multi-functional cells (also termed polyfunctional cells) secreting multiple cytokines are upregulated in responders.
Unique Visualization Options
A unique set of visualizations shows the impact of polyfunctionality and what it’s made up of, including:


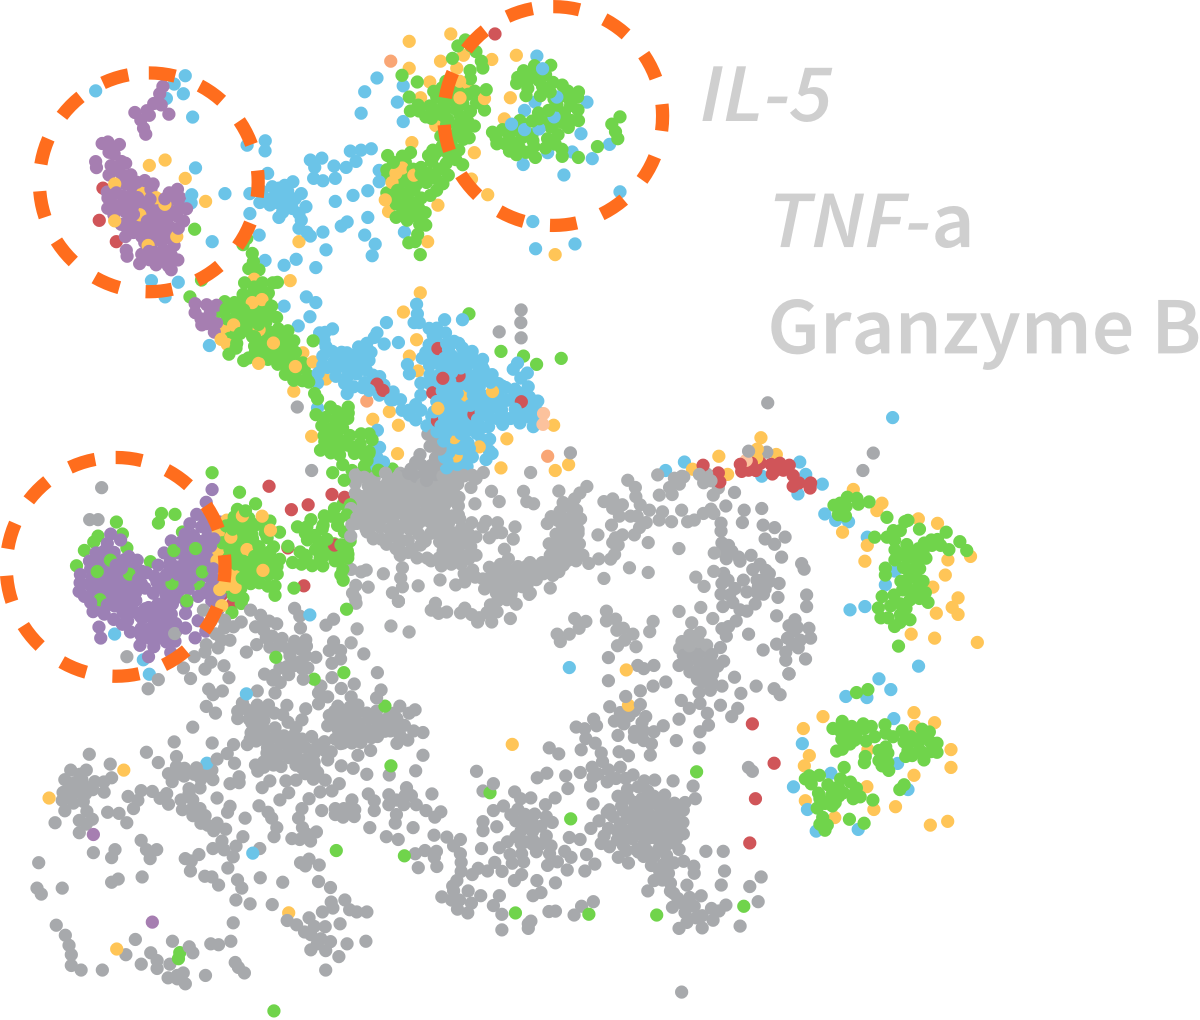
Utilize t-SNE to Differentiate Cellular Fitness by Cytokine Subset
The single cell cytokine mapping t-SNE provides a 3D visualization of single-cell functional cytokines and a high dimensional mapping of the unique polyfunctional cell subsets.
Discover Cell Product Potency Differences With Polyfunctional Strength (PSI) Cytokine Signatures
Polyfunctional Strength Index (PSI) aggregates all single-cell, multi-dimensional secretions from a sample into a single index. The readout combines the polyfunctionality of a sample (frequency of cells secreting multiple cytokines) with the signal intensities for each single cell across the secreted cytokines of the sample. The displayed index is color-coded to show the contribution from different categories of cytokines (e.g., effector vs. stimulatory cytokines).


Stratify Donor/Patient Response by Cellular Cytokine Signature Using Polyfunctional PCA
Dominant sub groups will emerge in PAT PCA graphs, representing significant multi-functional subsets driving the overall response.
Group Bioprocessing Correlations by Potent Polyfunctional Cells
Use Heterogeneity Heat Maps to uncover the critical cell subpopulations that exist only in the condition/group of interest.

Gain Data Mastery Quickly With an Easy to Use Interface
IsoSpeak’s push-button user interface and advanced automation allows users to visualize, target, and utilize data from direct, functional cytokine profiling of single cells for the first time:

| IsoLight System | ISOLIGHT-1000-1 |
| IsoSpeak Software | ISOSPEAK-1000-1 |
| IsoLight Service Agreement - 1 Year | SVCISL-1000-1 |
| IsoLight Service Agreement - 2 Years | SVCISL-1000-2 |
| IsoLight Service Agreement - 3 Years | SVCISL-1000-3 |